|
During the latter half of November, the team has been focusing on making necessary corrections to the project report and completing the final draft submission for the conclusion of the semester. To address comments made on the quarterly report, we corrected formatting issues, implemented more calculations and analytical content, as well as enhancing tables and figures. A calculation that needs to be implented is the peak flow. To calculate the peak flow, a model in HMS needed to be run. The peak flow caused by Shabakunk Creek, as well as the peak flow caused by the building footprint itself are going to determine the hydrologic components of our design. Simulations were run in HEC-HMS for a 100-, 10-, and 2-year storm event. In order to determine the impact of development, a simulation was run for the building footprint for both pre- and post-construction conditions. The curve number for pre-conditions was 75 while the curve number post-construction was 99. The table ( Figure 1) below shows the resulting peak flows that our HMS simulation calculated. In addition, we were advised to incorporate visual models and tables representing our cost estimates, rather then relying on strictly a written format. Figures 2 and 3 displayed below, the call-out map of TCNJ and the Fema flood map, are two examples of figures that were adjusted and installed into the project report to help achieve a thorough and successful documentation of our design project elements and details. 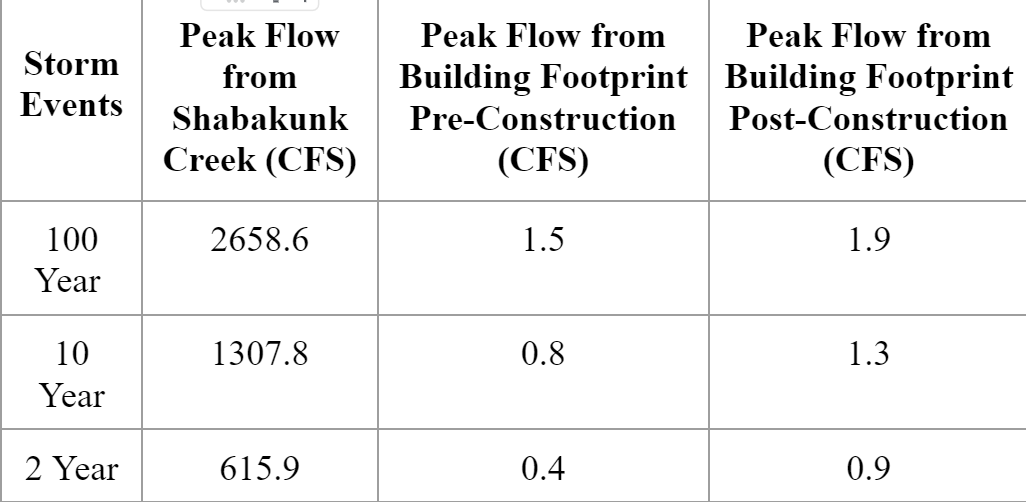 Figure 1: HMS-HEC Outputs of Peak Flow 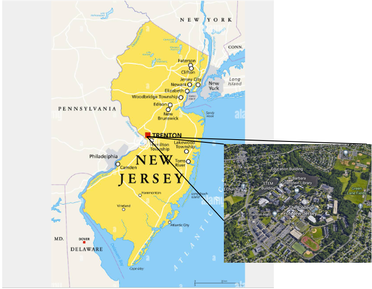 Figure 2: Callout Map of TCNJ 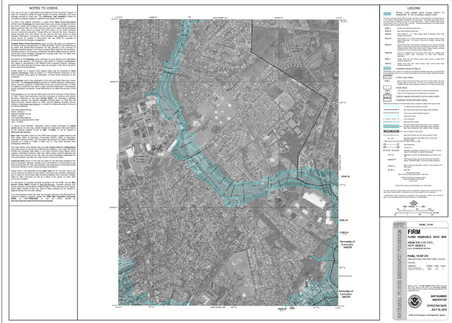 Figure 3: FEMA Flood Map
0 Comments
Utilizing the software program HEC- HMS, the hydrologic team conducted a simulation to determine the hydraulic peak flow caused by Shabakunk Creek. Within the simulation, a watershed area was created, and the model was run by inputting National Weather Service rainfall data from a 100-year storm event (Figure 1). The peak flow was calculated to be 1386.8 cubic feet per second. These outputs are exemplified in Figure 2. The next step for the hydrologic team will be to calculate the peak flow caused by the placement of the dormitory building. Once that value is determined, the storm water basins can be designed for the project. 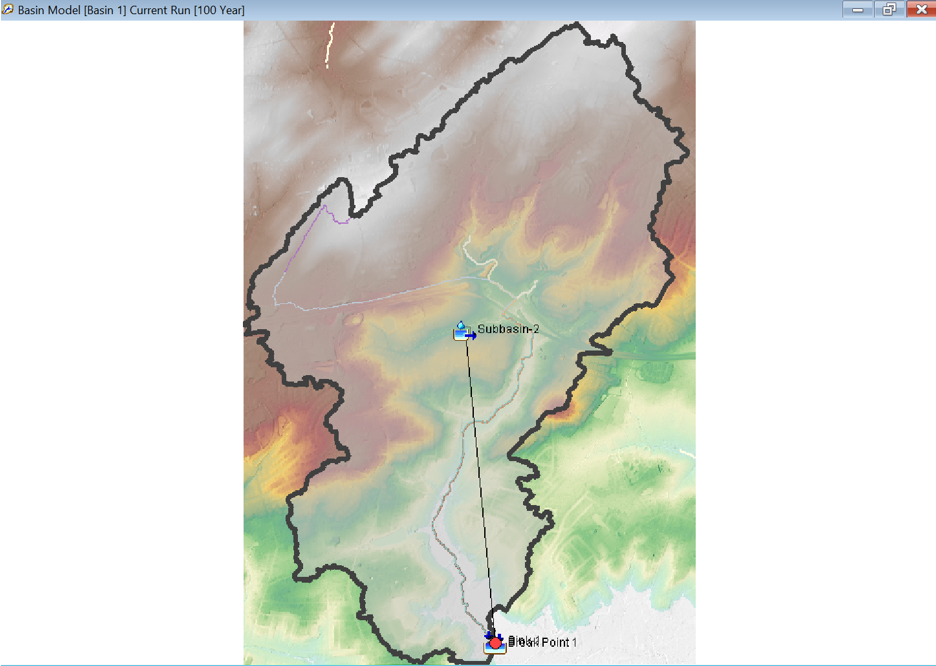 Figure 1: HMS Model of Watershed Area and Sub-basin 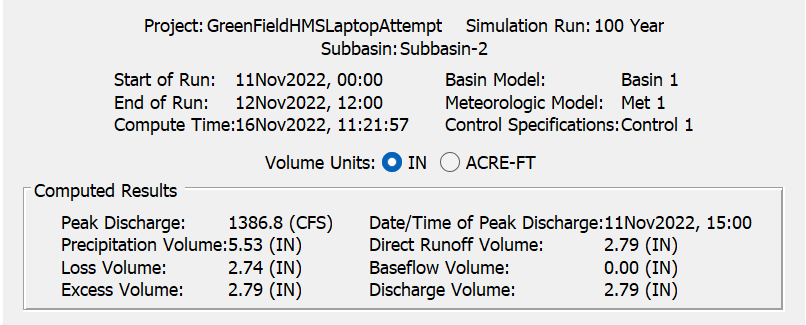 Figure 2: Table of Results from HMS Program. It shows Peak Flow for a 100 Year Storm Event.
|
CategoriesArchives
April 2023
|
 RSS Feed
